
Data Interpretation (DI) is an essential part of the BPSC Mains examination under the General Studies Paper I. It tests a candidate’s ability to analyze, interpret, and draw conclusions from various types of data, including tables, graphs, charts, and statistical information.
This section often focuses on topics like:
- Tabular Data: Reading and interpreting tabulated numerical data.
- Bar Graphs: Analyzing and comparing data trends.
- Pie Charts: Understanding proportions and distributions.
- Line Graphs: Identifying patterns and changes over time.
- Mixed Graphs: Combining multiple data representation forms.
BPSC Syllabus: Prelims + Mains
69th BPSC Mains
Candidates had to attempt two questions (Each Question of 36 Marks)
1. Study the following table carefully and answer the questions given below this table:
There are three companies X,Y and Z making identical soaps in the form of bars.
Soaps are sold by the number of units.
Total Sales= Selling price x Units Sold

(a) What was the average price of soap in the year 2013 (₹/unit)?
(b) What was the percentage decrease in units sold for X in 2012 over 2011?
(c) What was the percentage share of Z in the total units sold in 2013?
(d) In which year Y sold the maximum number of units?
(e) The maximum price per unit given in the table exceeds the minimum price per unit by what percentage?
or
The following pie-chart shows the expenditure incurred on the manufacturing of a calculator under various heads. Study the pie-chart carefully and answer the questions given below:

(a) What is the central angle of sector showing the expenditure incurred on paying for the software?
(b) What is the cost price of the calculator on which the cost of R & D and machinery charges amount to ₹ 127.50?
(c) The marked price of a calculator is 24% more than its cost price. If the marked price of
a calculator be ₹ 186, then what is the cost price of R & D used in a single unit of calculator?
(d) If the machinery charges of a single unit be ₹ 58.50 and the marked price is 30% more than the cost price , then what is the marked price of the calculator?
(e) If the profit of the manufacturer is 20% and the marked price of a calculator be ₹ 192, then how much money has been spent on it as miscellaneous charges?
2. Study the pie diagrams given below carefully which represent the expenditure of two families I and II on different items in percentages and answer the questions asked below. The annual income of families I and II are ₹ 4 lakhs and ₹ 5 lakhs respectively:
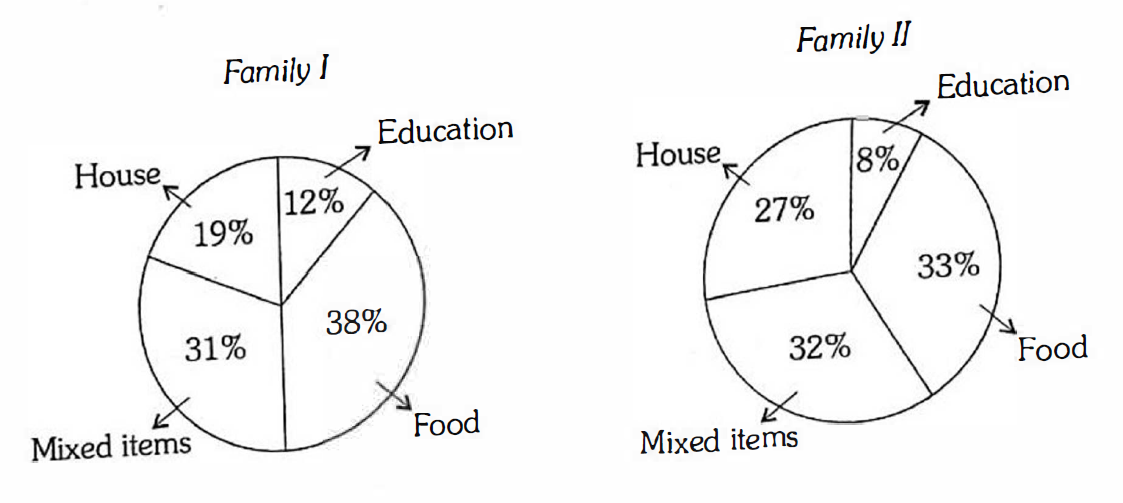
(a) How much less or more amount of money is spent on education by family II as compared to family I?
(b) Which one of the two families I and II spends more amount of money on food and how much?
(c) What is the proportion of money spent by families I and II on education?
(d) What would be the angle at the centre of pie diagram of money spent on housing by family I?
(e) How much money has been spent by families I and II together on mixed items?
or
The bar graph given below represents the additional tax collected by a State in different years. Study it carefully and answer the questions given below related to it:

(a) How much percentage decrease in additional tax was registered in 2020-21 as compared to 2018-19?
(b) How much percentage increase in additional tax was registered in 2017-18 as compared to 2016-17?
(c) During which year the maximum percentage increase in additional tax was registered as compared to its preceding year?
(d) From 2014–15 to 2020-21, what is the average of additional tax?
(e) During which two consecutive years percentage of decrease in additional tax was minimum?
68th BPSC Mains
Candidates had to attempt two questions (Each Question of 36 Marks)
1. Study the following table carefully and answer the questions given below this table:
Highest and Average marks obtained by students in five subjects during 2012-2017. The maximum marks in each subject are 100.

(a) What is the combined average marks of all the five subjects in 2015?
(b) What is the percentage increase in average marks of English from 2015 to 2017?
(c) During which year the difference between the highest marks and highest average marks in Maths was maximum?
(d) What is the percentage of (highest) marks in Hindi in 2013 with respect to average marks of Maths in 2016?
(e) lf 50 students took the examination in 2013 in Maths, what were their total marks?
(f) In between which two years, the difference of highest marks in Science was maximum?
or
Study the following graph carefully and answer the questions given below: Profit percent of companies ABC and DEF during the year 2001-2006

(a) Let the income in 2005 of companies ABC and DEF was in the ratio 3 : 4. What was the ratio of expenditures of companies ABC and DEF in 2005?
(b) If expenditure of company DEF in 2002 was Rs 190 cr., what was its income in the year 2002?
(c) If expenditures of company ABC and DEF were equal in 2001 and total income of both the companies in 2001 was Rs 825 cr then what was the total profit of both the companies in 2001?
(d) Income of company ABC in 2004 was Rs 750 cr. What was the expenditure in 2004?
(e) If income of both the companies was equal in 2003, find the ratio of expenditures of company ABC and DEF in 2003.
8. The Bar Graph given below shows the sales of books (in thousand numbers) from six branches of a publishing con1pany during two consecutive years 2000 and 2001.
Sales of Books (in thousand numbers) from Six Branches -B1, B2, B3, B4, B5 and B6 of a publishing company in 2000 and 2001 are following:

(a) What is the ratio of the total sales of Branch B2 for both years to the total sales of Branch B4 for both years?
(b) Total sales of Branch B6 for both the years are what percent of the total sales of Branch B3 for both the years?
(c) What percent of the average sales of branches B1, B2 and B3 in 2001 is the average sales of branches B1, B3 and B6 in 2000?
(d) What are the average sales of all the branches (in thousand numbers) for the year 2000?
(e) A total sale of branches B1, B3 and B5 together for both the years (in thousand numbers) is what?
or
The following pie-chart shows the percentage distribution of the total expenditure incurred by a company in different expense sections during 2015. Study the pie-chart and answer the questions given below:
Percentage distribution of total expenditure of a company
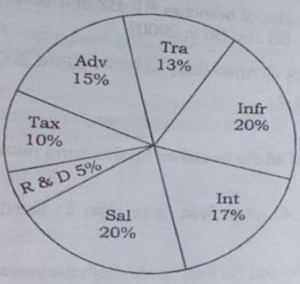
lnfr = Infrastructure
Tra = Transport
Adv = Advertisement
Tax =Taxes
R&D = Research and Development
Sal= Salary
Int= Interest on Loans
(a) How much times the total expenditure of the company is of expenditure of research and development?
(b) If expenditure on transport is Rs 2 crores, then what will be the difference between the expenditures on salary and advertisement?
(c) What is the ratio of the total expenditure of taxes and interest on loans and total expenditure on infrastructure and transport?
(d) If expenditure on interest on loan is Rs 2.60 crores, then what will be the total expenditure on advertisement, taxes and salary?
(e) How much times the difference of expenditure on interest on loans and the expenditure on advertisement is of the expenditure on advertisement?
67th BPSC Mains
Candidates had to attempt two questions (Each Question of 36 Marks)
1. Study the following table carefully and answer the questions given below:
Percentage marks obtained by seven students in six different subjects
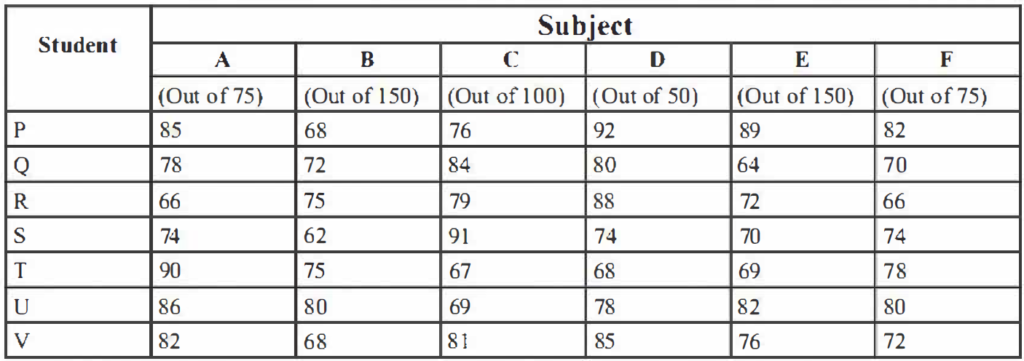
(a) Find the total percentage marks secured by R in all the six subjects together.
(b) Find the difference between the marks obtained by P in the subjects B, D and E together and the marks obtained by T in the same subjects.
(c) Find the average Marks obtained by all the students in the subject B.
( d) Find the average percent of marks obtained by all the students in the subjects C and D together.
(e) What is the total marks obtained by all the students in subject F?
2. Study the following pie-charts carefully and answer the questions given below:
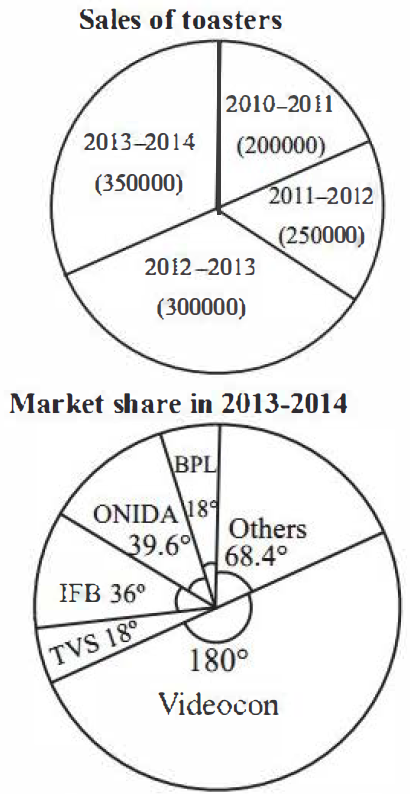
(a) Assuming that Videocon has maintained its market share at the same level from 2010-2011, what is the total number of toasters sold by Videocon in these four years?
(b) If in 2012-2013 the market share of BPL was 7%, then what is the change in the number of toasters sold by BPL from 2012-2013 to 2013-2014?
(c) If Maharaja is one of the companies included in ‘others’ and its sale constitutes 40% of ‘others’, then how many toasters of Maharaja were sold in 2013-2014?
(d) Assuming that the number of toasters sold increases at the same rate in 2014-2015 as it did from 2012-2013 to 2013-2014, and assuming further that TVS maintains its market share, what will be the number of units sold by TVS in 2014-2015?
(e) If in 2013-2014 IFB sold 7000 more units and effected the market share of other companies, then what would be its market share (in %)?
3. Study the following graph carefully and answer the questions given below:
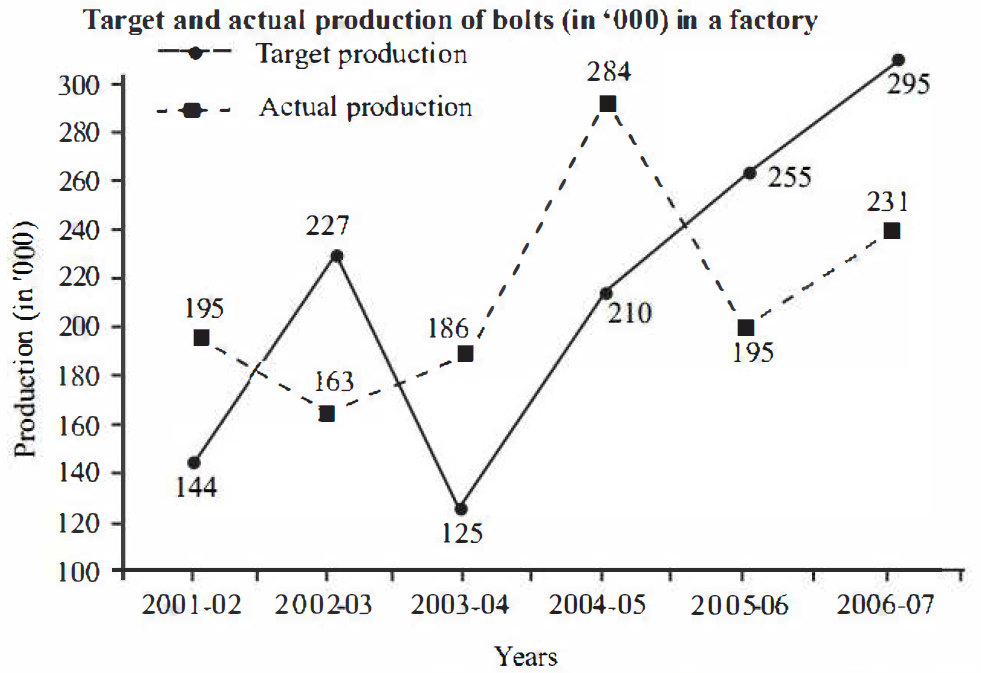
(a) What is the percentage change in the targeted production from 2004-2005 to 2005-2006?
(b) In which period was the percentage of actual production with respect to target production the highest?
(c) What is the ratio of the number of years in which the actual production was above the average actual production to the number of years in which the actual production was below the average actual production?
(d) Find the ratio of the sum of targeted production for the years 2002-2003, 2005-2006 and 2006-2007 to the sum of the actual production for these years.
(e) Find the difference between targeted production and actual production for the years 2002-2003 and 2005-2006.
15. The following bar graphs show the Per Capita Income and National Income of a country for the given years. Refer to the bar graphs to answer the questions that follow:

(a) What is the growth percentage in Per Capita lncome from 1951 to 1991?
(b) What is the annual growth rate of’ Per Capita Income from 1961 to 1971 (assuming that the growth was uniform throughout)?
(c) Find the country’s population during 1981.
(d) What was the growth rate in population during the decade 1981-1991?
(e) By how much per cent the National Income grew from 1951 to 1991?
66th BPSC Mains
Candidates had to attempt two questions (Each Question of 36 Marks)
1. The pie chart provided below gives the distribution of land in a village under various food crops. Study the pie chart carefully and answer the questions given below:

(a) Which combination of three crops contributes to 50% of the total area under the food crops?
(b) If the total area under jwar was 1.5 million acres, then what was the area (in million acres) under rice?
(c) If the production of wheat is six times that of barley, then what is the ratio between yield per acre of wheat and barley?
(d) If the yield per acre of rice was 50% more than that of barley, then the production of barley is what percent of that of rice?
(e) If the total area goes up by 5% and the area under wheat production goes up by 12%, then what will be the angle for wheat in the new pie chart?
2. The following line graph gives the percent profit earned by two companies X and Y during the period 1996-2001. Study the line graph and answer the questions that are based on it:

(a) If the expenditure of company Y in 1997 was Rs 220 crores, what was its income in 1997?
(b) If the income of two con1panies were equal in 1997, then what was the ratio of expenditure of company X to that of company Y in 1997?
(c) The income of the companies X and Y in 2000 were in the ratio of 3 : 4 respectively. What was the respective ratio of their expenditures in 2000?
(d) The expenditures of companies X and Yin 1996 ,vere equal and the total income of the two companies in 1996 was Rs 342 crores. What was the total profit of the two companies together in 1996?
(e) The expenditure of company X in the year 1998 was 200 crores and the income of company X in 1998 was the same as its expenditure in 2001. Find the income of company X in 2001.
3. Answer the following questions based on the information given below:
The first table gives the percentage of students in MBA class, who sought employment in the areas of finance, marketing and software. The second table gives the average starting salaries of the students per month (in Rs) in these areas. The third table gives the number of students who passed out in each year.

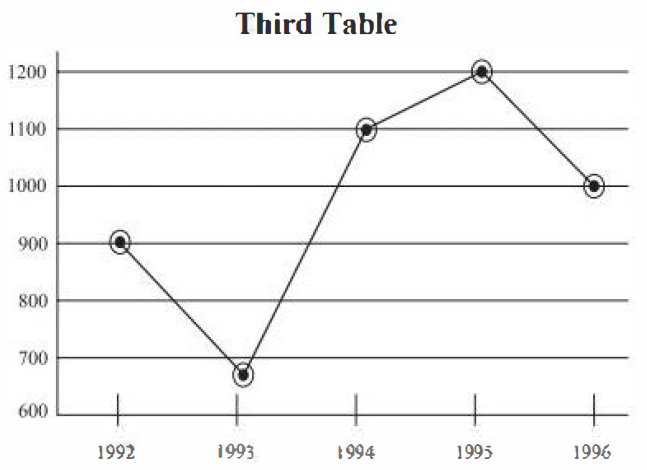
(a) Calculate the numbers of students who get jobs in finance less than the students getting marketing job in five years.
(b) What was the percentage increase in the average salary of finance from 1992 to 1996?
(c) Find the average annual rate at which the initial salary offered in software increases.
(d) What was the average monthly salary offered to a management graduate in 1993?
(e) Calculate the difference in earning by students seeking jobs in finance from those opting for software (per annum) in 1994
4. A soft-drink company prepares drinks of three different flavours-X, Y and Z. The production of the three flavours over a period of six years has been expressed in the bar graph provided below. Study the graph and answer the questions based on it:

(a) For which year, the percentage of rise/fall in production from the previous year is the maximum for the flavour Y?
(b) For which flavour the average annual production is maximum in the given period?
(c) The total production of flavour Z in 1997 and 1998 is what percentage of the total production of flavour X in 1995 and 1996?
(d) What is the difference between the average production of flavour X in 1995, 1996 and 1997 and the average production of flavour Y in 1998, 1999 and 2000?
(e) What was the percentage decline in the production of flavour Z in 2000 as compared to the production in 1998?
65th BPSC Mains
Candidates had to attempt two questions (Each Question of 36 Marks)
1. Given below is a pie diagram of population pertaining to the year 1998 and the table pertaining to sex
and literacy-wise population ratio of different States of India. Read these carefully and give answers to the questions that follow:


(a) What will be the percentage of females in UP, MP and Goa taken together of the total population?
(b) What was the total number of illiterate people in Bihar and UP?
(c) Find the ratio of the number of females in Delhi and Tamil Nadu.
( d) What was the percentage of females in all the mentioned States taken together?
2. The following chart shows the production of cars in thousands for different companies in India. Read the multiple bar diagram and answer the questions given below:
Production of cars for 2002-05 period from the selected manufacturers

(a) Which companies have shown the highest and the lowest percentage increase and decrease in production over last year? Also give the actual percentages.
(b) What is the ratio of differences between productions by Maruti and Honda during 2003-04 and 2004- 05?
(c) What are the ratios of total production of cars during the successive years?
(d) In 2005-06, the production of cars by Maruti and Hindustan Motors was doubled, while for all other companies the production remains the san1e. What is the percentage increase in overall production?
3. Study the following graphs and answer the questions given below:


(a) What was the percentage increase in cotton production and productivity in 2006-07 as con1pared to 2005-06?
(b) In how many hectares, the cotton was grown in 2009-10 and 2010-11 ‘?
(c) In which year, the cotton production has sho,vn n1aximum percentage decrease as compared to last year?
(d) In which year, the cotton has shown maximum percentage increase in productivity as compared to last year?
(e) In which year cotton cultivation area was the lowest and how much percentage of maximum area?
(f) Assuming cotton price as Rs 1,250 per quintal, what would have been the income of a farmer who had 5 hectares of cotton area in 2008-09?
4. Study the following line graph which gives the number of students who joined and left the school in the beginning of the year for six years fron1 1996 to 2001. Initial strength of the school in 1995 was 3000. Answer the questions based on the line graph given below:

(a) The number of students studying in the school in 1998 was what percent of the number of students studying in the school in 2001?
(b) Find the ratio of the least number of students who joined the school maximum number of students who left the school in any of the years during the given period.
( c) During which year, the percentage increase in the strength of school was minimum’?
( d) What was the percent increase/decrease in the number of students from 1998 to 1999?
(e) Find the ratio of the maximum number of students who joined the school to the minimum number of students who left in any of the years.
(f) In which year, the strength of the school was maximum?
64th BPSC Mains
Candidates had to attempt two questions (Each Question of 36 Marks)
1. The following charts depict the distribution of overseas tourists from India to various countries and also the age distribution of tourists from India during the year 2017:

(a) If amongst the European Union, Switzerland accounts for 25% of tourists traffic and it is known from official Swiss records that a total of 4 lakh Indian tourists visited Switzerland during the year 2017, then how many total number of Indian tourists in the age group of 40-49 years went abroad from India during the year 2017?
(b) If the total number of tourists of age group 30-49 is 2400000, what is the number of tourists who are more than 60 years of age?
(c) If total number of Indian tourists who went to China more than 40 years of age, was 360000 constituted 30% of total tourists to China, then how many tourists of other age groups went to China?
(d) Assuming that the total number of tourists from India going abroad increased by 20% in the year 2018, what will be the total number of tourists in age group less than 30 in the year 2018?
(e) If per capita spending per day of tourists in UK is Rs 6,000 and that in USA is Rs. 5,000 and it is known that 32,00,000 tourists visited these two countries, what was the total spending of the tourists in these countries?
2. The following multiple bar chart shows production of same type of vehicle (in thousands) for a period of three years by selected manufacturer and the line chart shows prices of vehicles in the year 2017:

(a) What is the percent increase in the production of vehicles in 2017 from 2015?
(b) Which manufactures have produced the same number of vehicles during the period under consideration?
(c) What percent of the total production of vehicles is produced by manufacturers A and D?
(d) For which manufacturer, the profit percent is maximum in the year 2017?
(e) If the manufacturer D had to call back 4000 of its vehicles due to some defects, what is percent profit/loss of the company?
3. The following graph shows the populations of three countries during the years 2012-17:
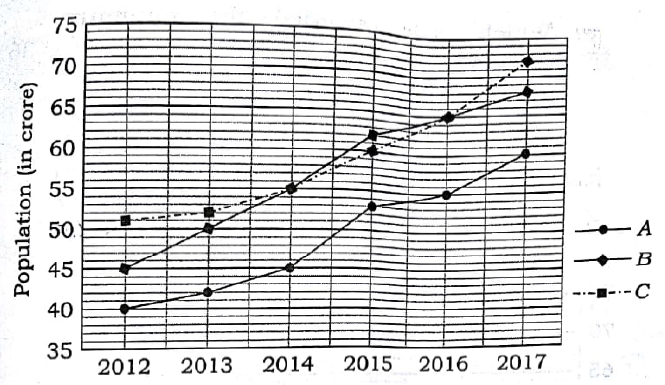
(a) What percent of total population is accounted by the country A in the year 2017?
(b) If the sex ratios of countries B and C in the year 2016 were 106.5 and 105.2, what is the nun1her of females in these countries?
(c) If the number of females in the country A in the year 2014 is 21.25 crores, what is the sex ratio of country A in the year 2017?
(d) Which year recorded the maximum growth of population in three countries?
(e) Which year recorded the minimum growth of the population?
4. The graph below gives exports (Rs. in thousand crore) from three companies X, Y and Z over three years. Study the line graph and answer the questions given below:

(a) Average annual exports for companies X and Y, respectively are approximately what percent of the average annual exports of company Z during the given period?
(b) What is the difference between the maximum and the minimum average annual export over the years?
(c) In which years, the average annual exports of the companies were same?
(d) In which years, the exports from company Z were more than the average annual exports of all the companies?
(e) What is the percent increases in the total export of all the companies during the years 2015-2017 in comparison to the years 2011-2014?
63rd BPSC Mains
1. In a city of Maharashtra, the main mode of transport is the car. The following chart shows the population trends and car use trends during the period 2011-2016. Study the chart and answer the questions that follow:

(a) In 2014, if the females used 30% of the total cars, then what is the per capita use of cars by females in 2014?
(b) What is the average percentage increase in the number of cars over the period 2011-2016?
(c) Find the year in which the ratio of males to that of females was the highest.
(d) In which year was the ratio of male population to the number of cars in the city the lowest?
(e) By what percentage did the number of cars in the city increase from 2011 to 2016?
2. Study the following pie charts, which show the expenditure on various heads in the second and third Five-Year Plans (FYP) and answer the questions given below:

(a) By what percent did the expenditure on irrigation increase in the third FYP compared to the second FYP?
(b) What is the ratio of expenditures on village industry in the second and third FYPs?
(c) By what amount should the expenditure on agriculture in the third FYP be increased or decreased to make it 2.5 times the expenditure on agriculture in the second FYP?
(d) By what percent is the expenditure on agriculture in the third FYP higher or lower than the expenditure on industry and mining in the second FYP?
(e) By what amount did the expenditure on transportation and communication increase or decrease in the third FYP compared to the second FYP?
(f) If the total expenditure in the fourth FYP increases by 80% compared to the third FYP and the segment of expenditure on social service and miscellaneous makes an angle of 78° at the center of the pie chart for the fourth FYP, then what will be the expenditure on social service and miscellaneous in the fourth FYP?
3. Study the data given in the following multiple bar chart, which shows the sex ratio in Madhya Pradesh during the period from 1901 to 1971 and answer the questions given below:

(a) What are the ratios of females per 1000 males in rural and urban areas of Madhya Pradesh in the 1941 and 1951 Census? In which year was it higher?
(b) What is the percentage change in females per 1000 males in urban areas of Madhya Pradesh in 1961 compared to 1931?
(c) Compare the ratio of females per 1000 males in total and rural areas of Madhya Pradesh in the 1911 and 1921 Census. In which year was it higher?
(d) In which census years were the female sex ratio in urban areas of Madhya Pradesh highest and lowest? What is the difference between these two?
(e) If in the 1931 Census, due to some error in counting, 15 females per 1000 males were wrongly counted in the urban area instead of the rural area of Madhya Pradesh, then what should have been the actual percentage of females per 1000 males in the urban area of Madhya Pradesh compared to the rural area in 1931?
(f) If in the 1971 Census, there were 90 crore males in rural areas of Madhya Pradesh, then what is the difference between the male and female population in rural areas of Madhya Pradesh in 1971?
4. Study the following line graph, which gives the Public Sector Banks’ advances (₹ in crores) to the three priority sectors, viz., agriculture, small-scale industries, and other private sectors during the period from 1970 to 1976, and answer the questions that follow:

(a) What percentage more advance was given by the public sector banks to small-scale industries in comparison to agriculture in 1971?
(b) Find the ratio of advances given by the public sector banks to agriculture, small-scale industries, and other private sectors in 1972.
(c) The total advance counted yearly from 1970 to 1976 by the public sector banks to small-scale industries is what percentage of that to agriculture?
(d) If 40% of the advance given to small-scale industries is utilized in the cottage industry, what amount was utilized in the cottage industry in 1975?
(e) Find the ratio of advances given by the public sector banks on three occasions between 1970 and 1976 when it was equal for agriculture and small-scale industries.
(f) In which two years was there a decrease in advance given by public sector banks to agriculture relative to the last year? Also, find the percentage decrease in advance in these two years.
60th-62nd BPSC Mains
1. Study the following line graph, which gives the percent profit earned by the three companies A, B, and C during the period from 2011 to 2016, and answer the questions given below:

(a) The income of company B in 2012 was ₹60 lakhs, which increased by 30% in the year 2013. Find the expenditure of company B in the year 2013.
(b) If the expenditures of companies A, B, and C in the year 2016 were equal and their total income in that year was ₹870 lakhs, find the profit of each company in that year.
(c) If the expenditures of companies A, B, and C were ₹200 lakhs, ₹300 lakhs, and ₹400 lakhs, respectively, in the year 2014, find the ratio of their profits in 2014.
(d) If the incomes of companies A, B, and C in the year 2015 were equal and their total expenditure in that year was ₹1835 lakhs, find the profit of each company in that year.
2. Study the data given in the following multiple bar chart, which shows the production, export, and import (in ₹ crore) of country X during the period from 2006 to 2013, and answer the questions given below:

(a) In which years was the ratio of export and import maximum and minimum for country X? What were those ratios?
(b) In which year was the highest percentage of its production exported? What was that percentage value?
(c) If for country Y, the ratio of production, import, and export is 7:6:5 and production in Y in the year 2014 is double the production in X in the year 2013, what was the value of the export and import from Y in the year 2014?
(d) What percentage of production was imported in the years 2008 and 2012 in country X?
(e) What percentage of export should be increased in 2007 in X so that the difference between its production and export is 1/4 of its import?
3. Study the following pie charts, which show the sales for a company in India in the year 2016-17, and answer the questions given below:


(a) In the next year, the sales of cars were expected to be double. Assuming that the total sales increased by ₹200 million, what would be the percentage share of cars in the total sales?
(b) If in the subsequent year, the sales of mobiles are to increase their share by 20%, then assuming that the total sales are again increased by ₹200 million, by how many million rupees would the mobile sales increase?
(c) If 40% of the cement sales were in Maharashtra, then what was the value of sales of other products in Maharashtra in millions of rupees in 2016-17?
(d) If in 2016-17, Delhi had sales only in cement, steel, and cars in the ratio 5:3:1, then what percentage of cement, out of the total cement sales in India, was sold in Delhi?
4. The following graph shows the expenditure on arms of the three countries A, B, and C (in ₹ thousand millions). Answer the questions that follow on the basis of the graph:

(a) Which country had the steepest rise in its expenditure on arms compared to the previous year and in which year?
(b) What was the percentage increase in expenditure on arms of country A in 2017 compared to 2012?
(c) The amount spent by country B in 2017 is what percentage of the amount spent by it in 2011?
(d) If in 2018, the amount spent by country C will be 30% more than that in the last year and the amount spent by country A in 2018 remains the same as that in 2017, what will be the difference between the amounts spent by countries C and A on arms in the year 2018?
(e) What percentage of expenditure on arms should be increased by countries A and B in 2015 so that the expenditure on arms by A, B, and C becomes the same for the year 2015?
Also Read: BPSC Mains PYQs Subject Wise
Follow Fusion IAS